Cost–Latency Optimization for LLM Serving Engines Batching and Quantization
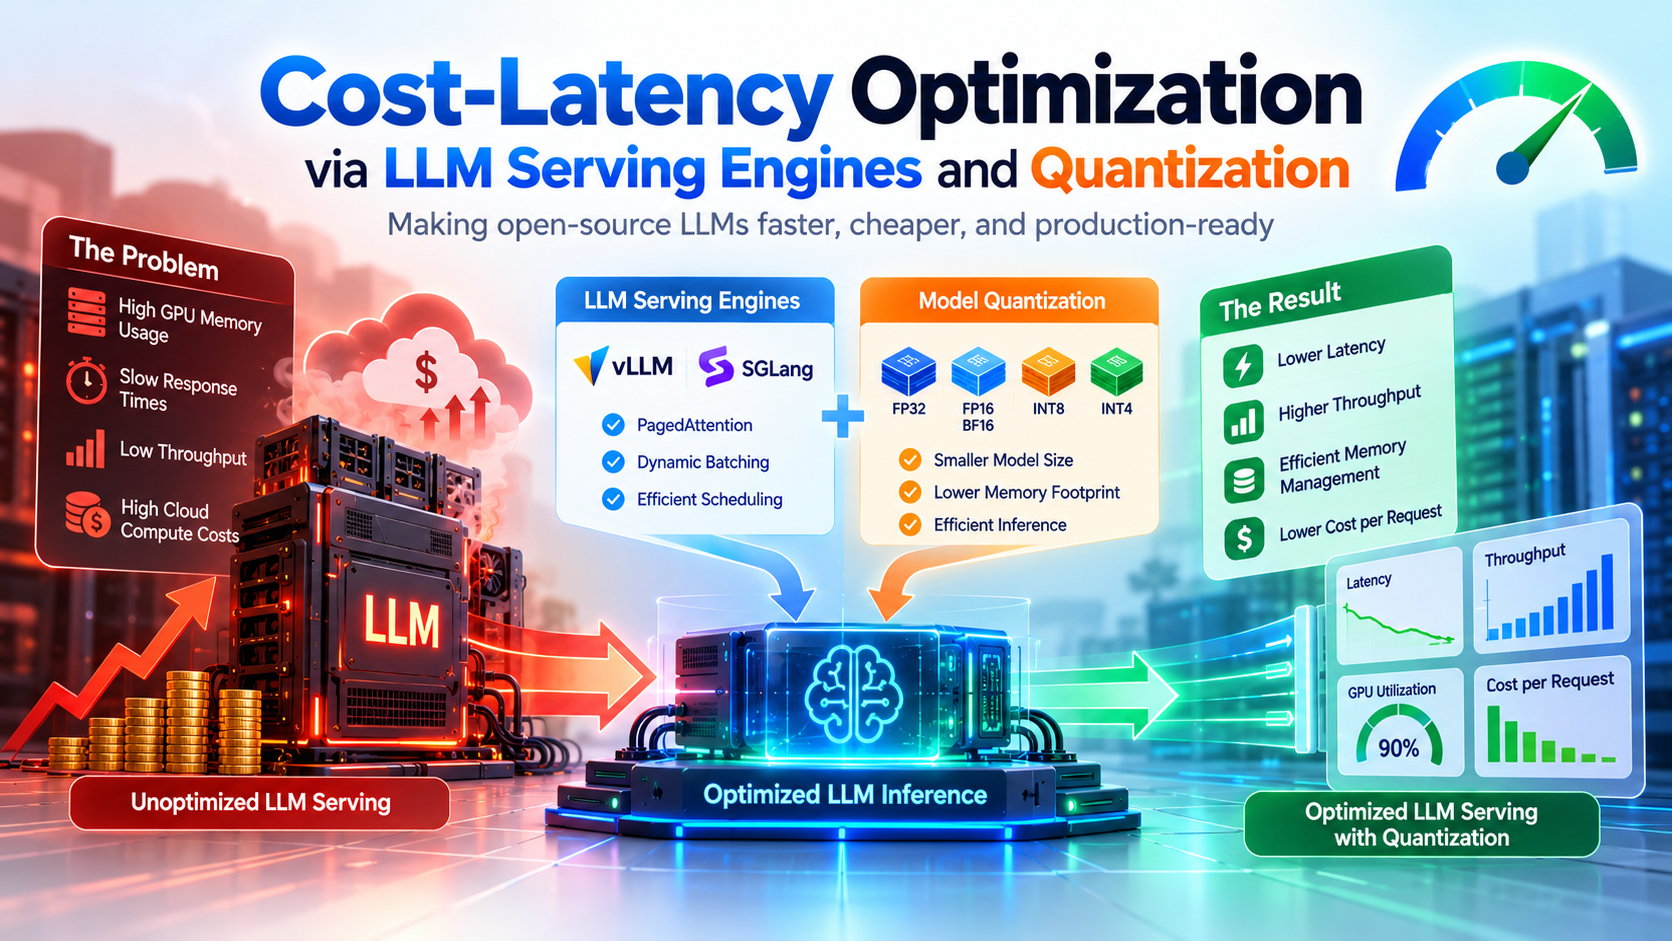
Optimizing LLMs for speed, cost, and scalability.
Executive Summary
Serving a large language model (LLM) in production takes more than loading it onto a GPU. The service must manage incoming requests, memory, response speed, output quality, and hardware cost.
Two useful tools work at different levels. A serving engine schedules requests and manages memory. Quantization stores model values with fewer bits, which can reduce memory use and sometimes improve speed. Results depend on the model, GPU, prompts, and traffic. This guide explains the main ideas in plain language and gives a step-by-step way to measure changes safely.
Introduction
A model may feel fast when one person tests it, then slow down when many people send long prompts at once. In production, requests arrive together, answers stream over time, and the service may need to meet response targets. The best setup depends on the model, software, hardware, and the work users send.
Key Concepts
Inference: using a trained model to create an answer, one token at a time.
Serving: the software that receives requests, schedules model work, manages memory, and returns answers.
Latency: how long a user waits. Time to first token (TTFT) is the wait for the first streamed token; time per output token (TPOT) is the pace of later tokens; end-to-end latency is the full request time.
Throughput: how many requests or output tokens the service completes per second. High throughput does not always mean each user waits less.
GPU utilization: how busy the GPU is. This helps identify unused capacity, but does not measure quality or waiting time by itself.
KV cache: temporary data kept for tokens already processed, so the model can continue generating without repeating some work.
Quantization: storing model values with fewer bits to reduce memory needs and sometimes improve speed.
Batching: processing multiple requests together. Static batching waits for a fixed group; dynamic batching groups arrivals over a short window; continuous batching lets new requests join as others finish.
Why Production Serving Gets Expensive?
GPU memory must hold the model weights, runtime data, and request state. KV cache grows as more requests are active and their context gets longer. When memory is tight, the service may accept fewer requests, make users wait, or fail to reserve enough cache. Poor scheduling can also leave the GPU idle. Adding GPUs costs more and does not automatically fix inefficient scheduling or memory use.
From Prompt to Response
Inference has two main stages. During prefill, the model reads the prompt and prepares its state. During decode, it creates the answer one token at a time and reuses the KV cache. Long prompts can increase TTFT; long answers and many active users can slow token generation or use more cache. Measure TTFT and TPOT separately to see where users are waiting.

Requests enter a queue, the model reads each prompt during prefill, then generates tokens in a decode loop until the answer is complete. TTFT tracks the wait to token one; TPOT tracks later tokens.
Common Bottlenecks
Look at these common causes when serving feels slow or expensive:
Memory pressure: model weights and KV cache compete for GPU memory. More active requests and longer context use more cache.
Compute or memory bandwidth: the GPU may be busy processing a long prompt or moving data while generating tokens.
Queueing and scheduling: requests may wait to enter a batch, or the GPU may sit idle between batches.
Work outside the model: tokenization, retrieval, network calls, routing, and response handling also add time.
The limiting factor can change with the model, hardware, prompt length, output length, and traffic. Measure before choosing an optimization.
Serving Engines: vLLM and SGLang
A serving engine acts like a dispatcher. It accepts requests, manages queues, chooses which requests can run together, handles cache, runs the model, and streams the answer back.
vLLM is a general-purpose serving engine with block-based KV-cache management, continuous batching, and prefix caching. SGLang supports structured model programs and includes RadixAttention, which can reuse cache when requests share a prefix. That may help with repeated system prompts or shared documents.
Neither engine is best for every workload. Compare them using the same model, hardware, prompts, concurrency, output limits, and quality checks. Check current documentation to confirm support for your exact model and quantization format.
PagedAttention: Flexible KV-Cache Allocation
Requests use different amounts of cache. Reserving one large, continuous space for every request can leave unused gaps. PagedAttention stores cache in fixed-size blocks and uses a map to find them. Blocks can be added as a request grows and released when it ends. Think of a library catalog that points to pages on different shelves.
This approach can make cache allocation more flexible and reduce wasted space. It does not compress model weights or make each cache value smaller. Some systems can also share cache blocks for matching prompt prefixes.
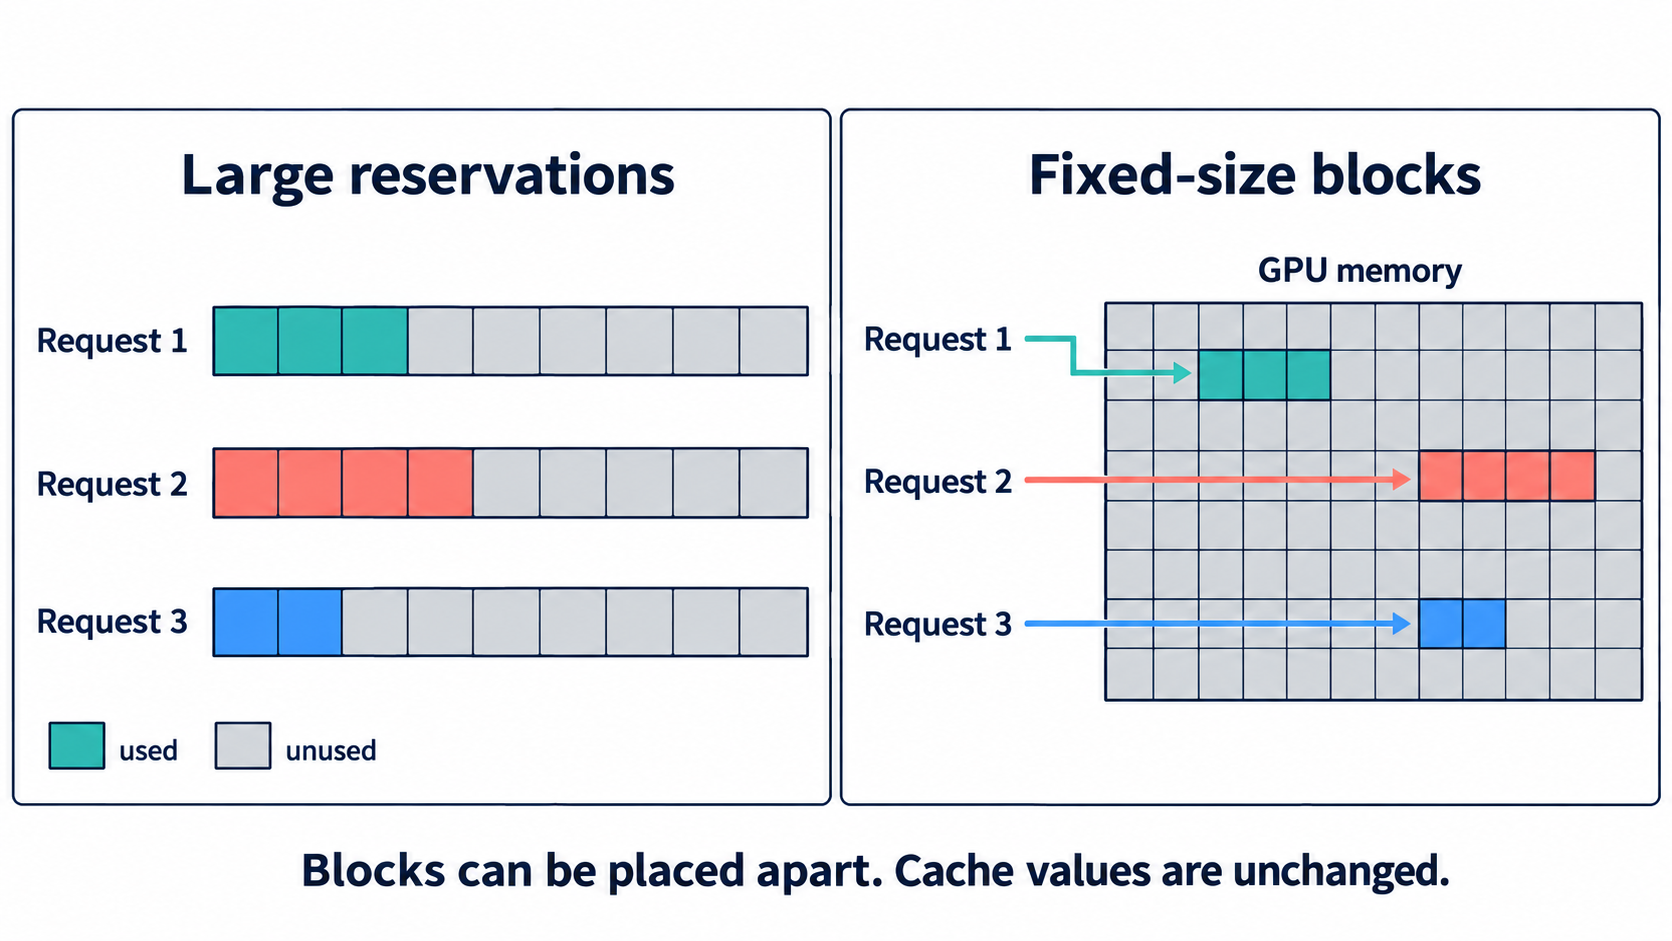
Large reservations can leave unused memory. Fixed-size KV-cache blocks are allocated as a request grows and located through a map; the cache values themselves are not compressed.
Batching Requests
Static batching waits for a fixed group of requests. It is simple, but short requests may finish while longer ones still occupy the batch. Dynamic batching collects arrivals briefly before starting; a longer wait can make a larger batch but delay users. Continuous batching adds new requests as other requests finish, filling open spots.
Continuous batching can improve throughput when traffic suits it, but it does not guarantee lower latency. A heavier batch may increase waiting or resource contention. Tune for user response targets as well as total work completed.
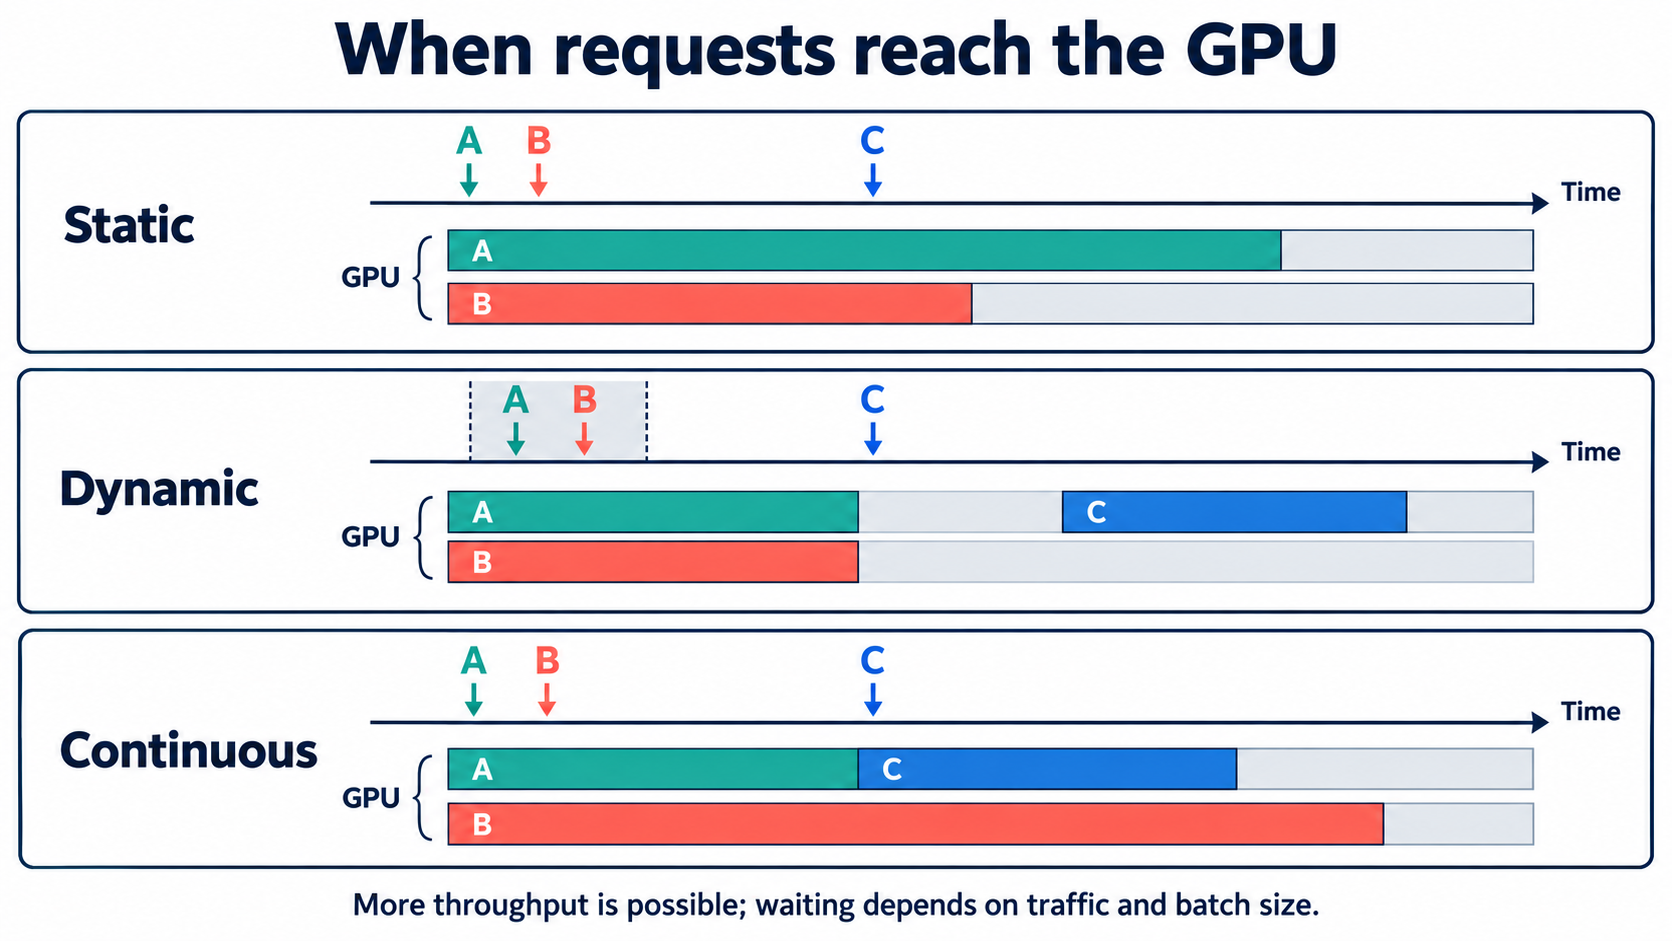
Static batching waits for the group; dynamic batching waits briefly to collect arrivals; continuous batching refills slots as requests finish. The best choice depends on traffic and response targets.
Quantization: Fewer Bits for Model Values
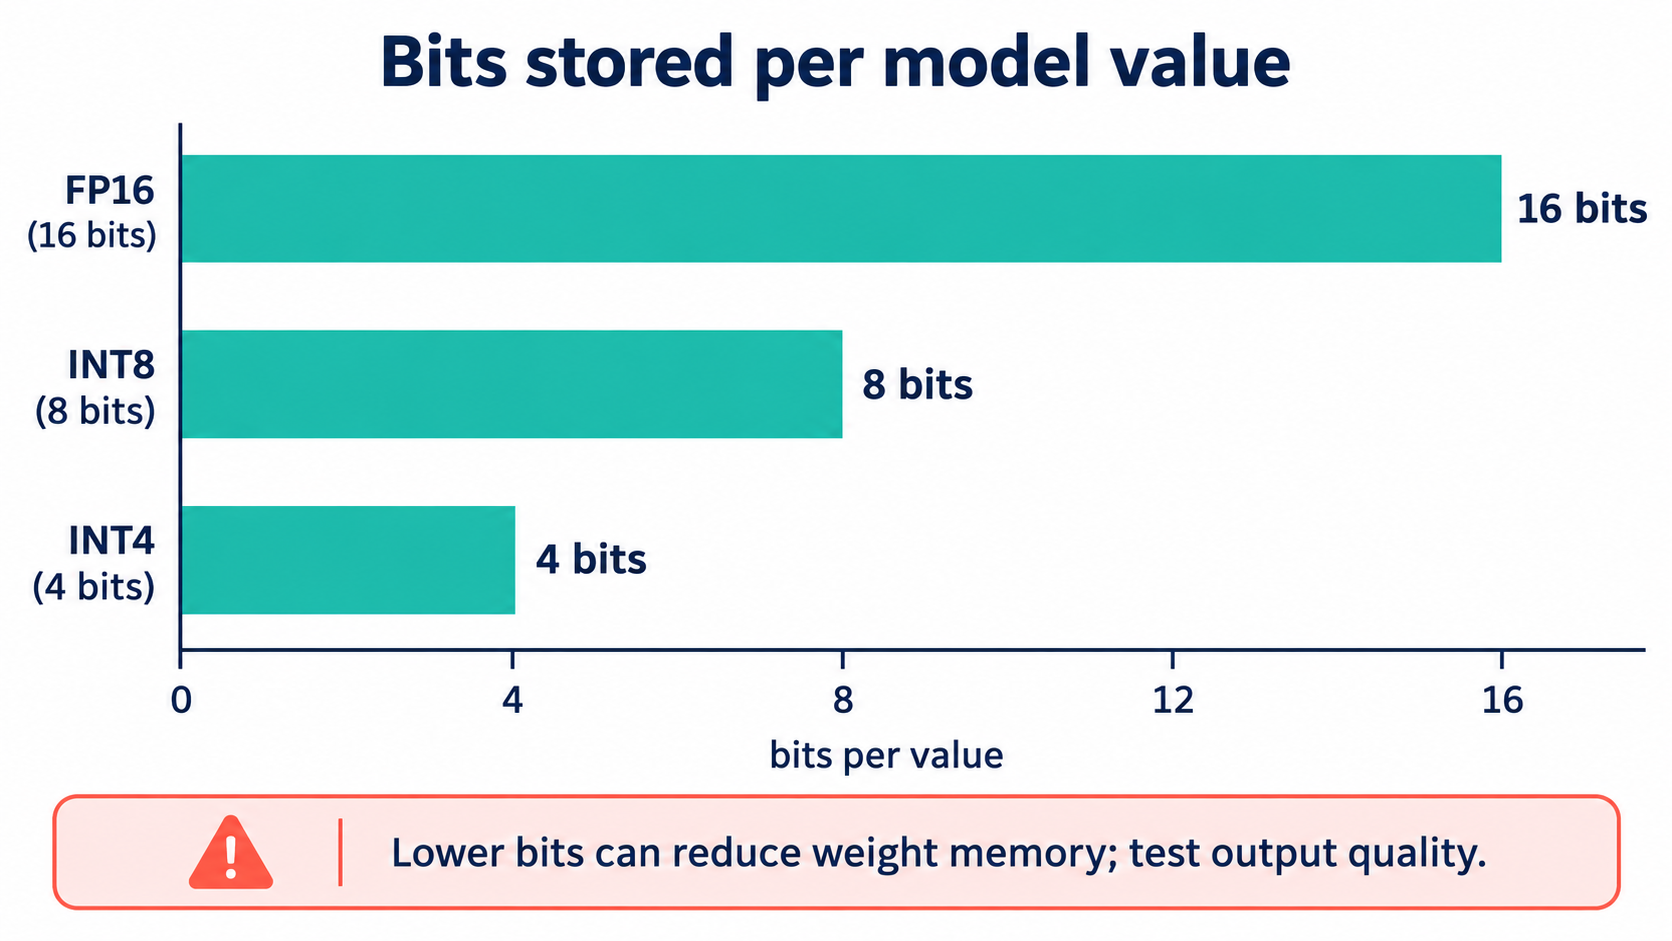
Model weights are numbers. FP32 uses 32 bits per value; FP16 and BF16 use 16-bit floating point; INT8 and INT4 use 8 or 4 bits. Lower-bit formats can reduce weight memory and leave more room for request cache. Speed depends on the GPU and software kernels, and output quality can change.
FP16 stores 16 bits per value, INT8 stores 8, and INT4 stores 4. Smaller weights can free memory; measure speed and check output quality on your own workload.
Post-Training Quantization (PTQ)
PTQ converts a trained model to a lower-bit format. Some methods use a small, representative sample of data to guide the conversion. A practical first test is to pick a format supported by your engine, load the converted model on the target GPU, and check real tasks, safety, tool use, memory, TTFT, TPOT, throughput, and cost.
Quantization-Aware Training (QAT)
QAT exposes a model to low-precision effects during training or fine-tuning, so it can adapt to them. It may help if PTQ causes too much quality loss, but it needs extra data, compute, and engineering. Start with PTQ. Consider QAT only when tests show that the extra effort is worthwhile.
Combining Serving and Quantization
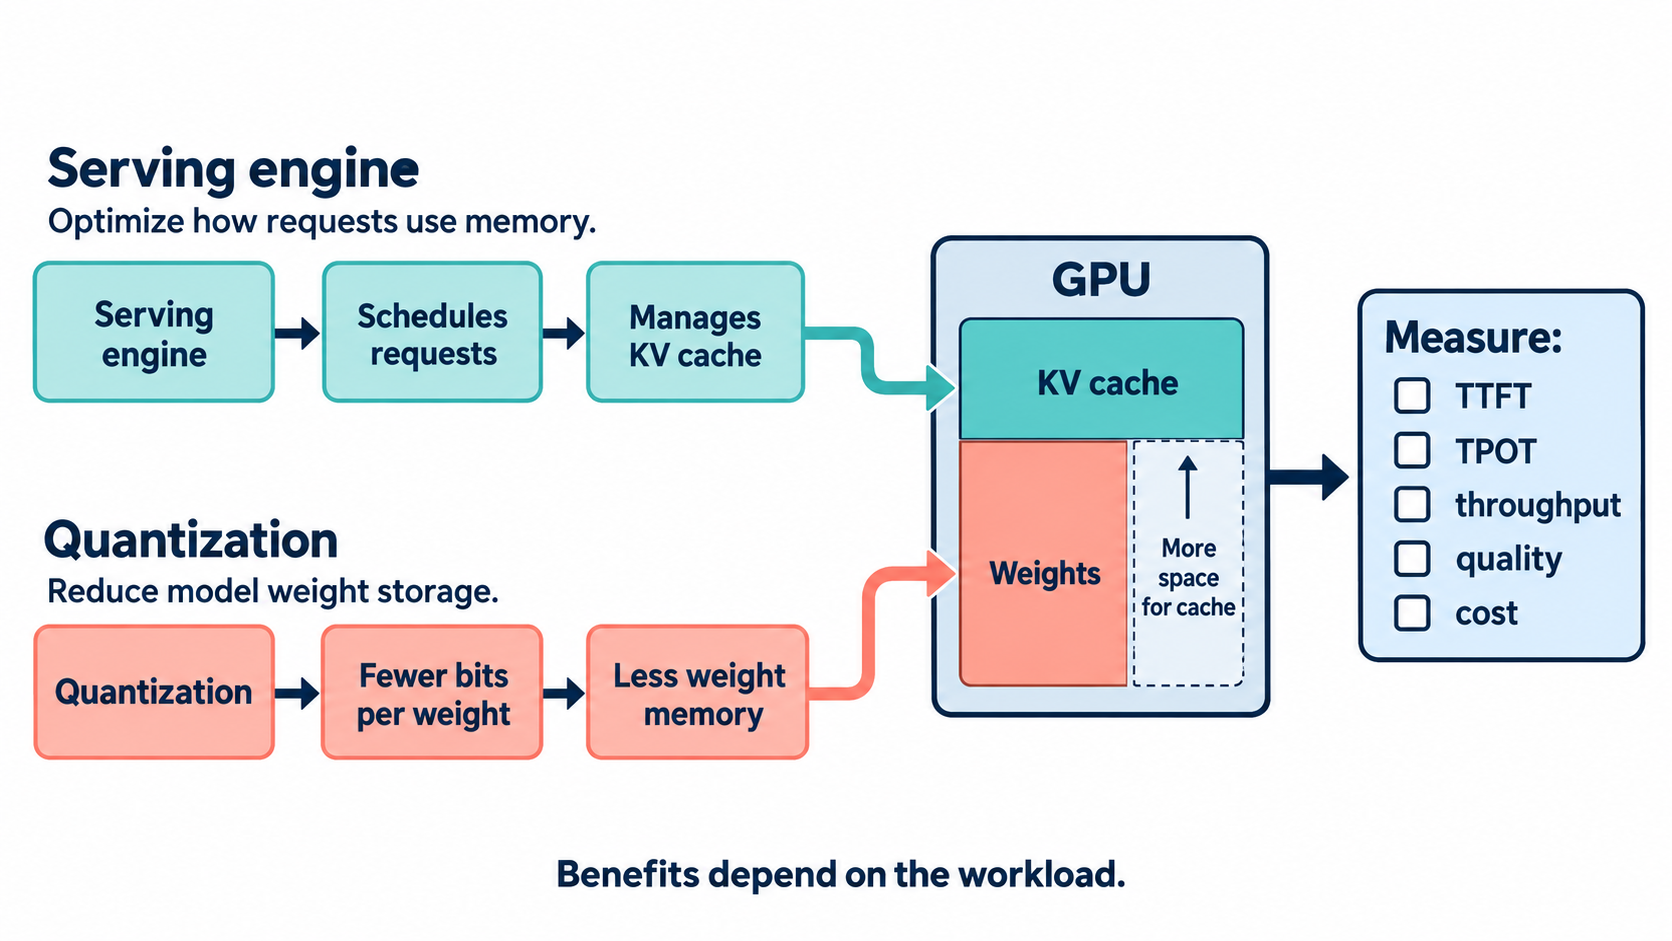
Serving improvements change how requests are scheduled and how cache is managed. Quantization changes how much memory the weights use. Together, they may leave more memory for active requests or help the GPU run more efficiently. Their effects interact, so measure the combined setup instead of adding together separate performance claims.
Serving controls request scheduling and KV cache; quantization reduces weight storage. Their effects meet in GPU memory, so check TTFT, TPOT, throughput, quality and cost together.
Metrics to Track
TTFT and TPOT: record typical and slow-request percentiles to understand first-token wait and streaming pace.
End-to-end latency: time the whole request.
Throughput: count completed requests and generated tokens per second.
Resource use: record GPU memory, utilization, cache pressure, and queue time.
Quality: check representative tasks, safety cases, and tool calls.
For each comparison, record the model, engine version, GPU, quantization format, prompt and output lengths, concurrency, and generation settings. This makes the result repeatable.
Practical Optimization Workflow
Use this process to find changes that help your users without hiding quality problems:
Measure the current setup: Run representative requests and record response time, throughput, GPU memory, and quality.
Find where the wait happens: Use TTFT to check the wait for the first token and TPOT to check the speed of later tokens.
Identify the likely limit: Check whether the issue is queueing, long prompts, GPU compute, memory bandwidth, or cache pressure.
Change one serving setting: For example, adjust batching or enable a supported prefix cache. Keep the model and test prompts the same.
Compare the result: Check user wait times, throughput, memory use, and task quality against the original setup.
Test quantization separately: Try a supported PTQ format and repeat the same checks.
Test the combination: If each change helps on its own, measure them together at normal and peak traffic.
Choose by useful outcomes: Compare cost per successful task alongside quality and slow-request latency.
Roll out carefully: Increase traffic gradually, monitor results, and keep a way to roll back.
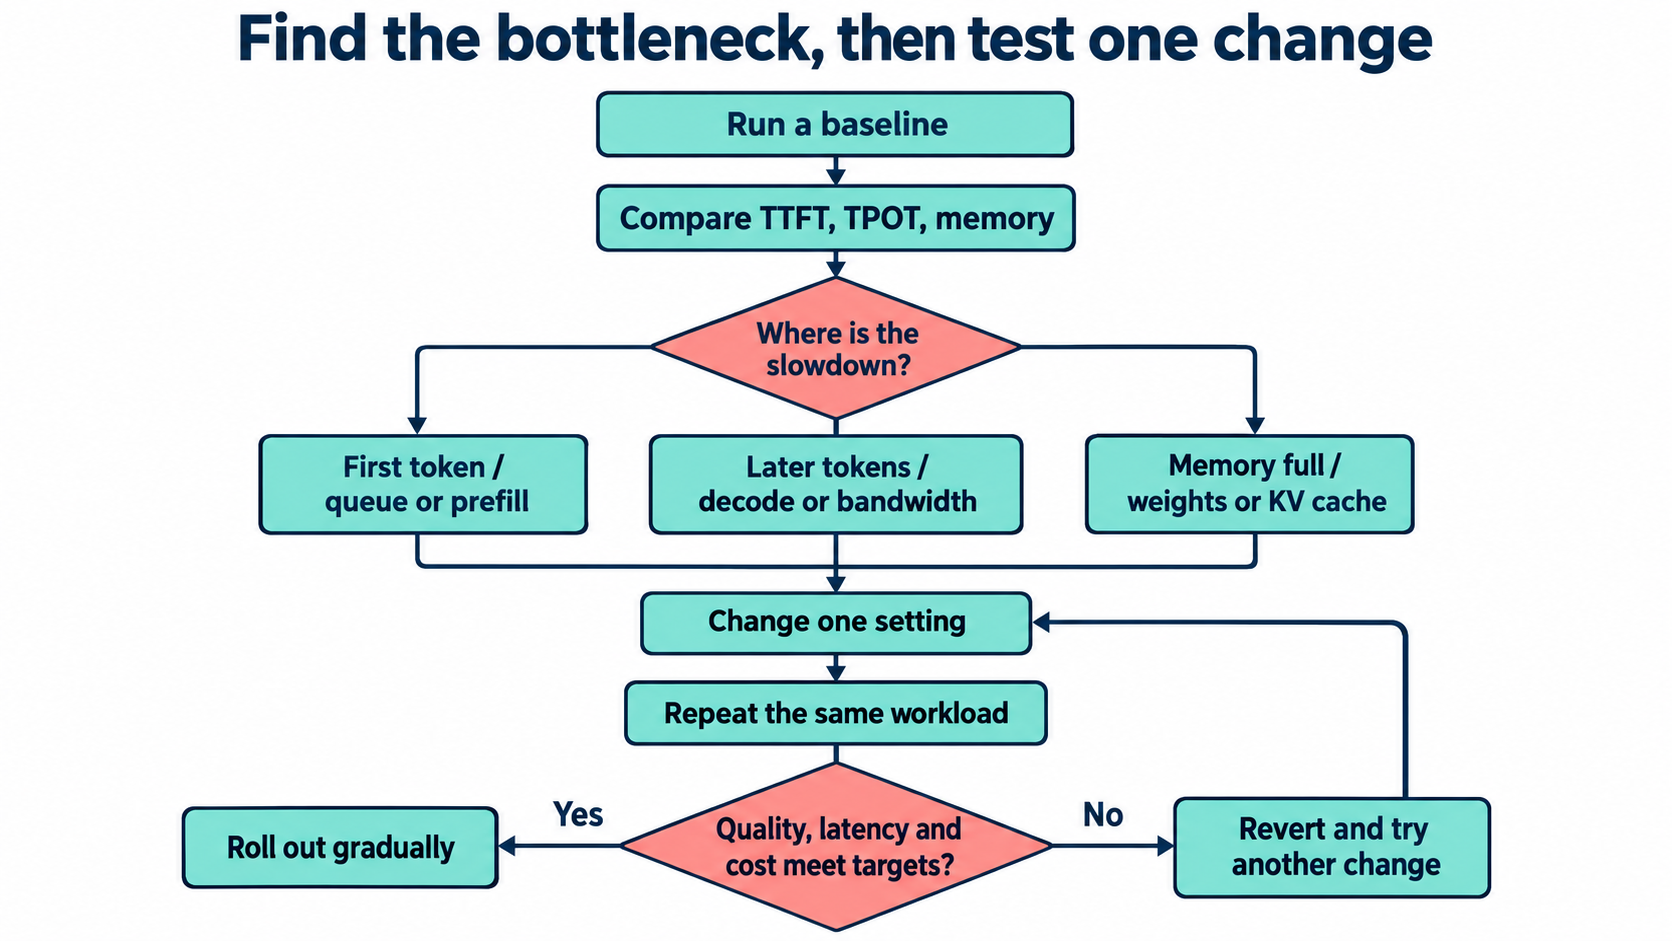
Measure a baseline, find the limiting factor, and change one setting at a time. Keep the change only if the same workload improves without unacceptable quality loss; roll out gradually or revert.
Quick Decision Guide
First token is slow? Check queue time, prompt length, prefill work, and repeated prefixes.
Tokens arrive slowly? Check decode speed, memory bandwidth, batch mix, and supported GPU kernels.
GPU memory is full? Check model weight format, context length, active requests, and KV-cache use.
Throughput is low while the GPU has room? Review scheduling and batch formation.
Quality dropped after quantization? Try a less aggressive format or another supported method; consider QAT if needed.
Key Takeaways
Efficient serving depends on the model, runtime, GPU, and workload together.
TTFT, TPOT, total latency, throughput, and quality measure different things.
KV cache grows with active requests and context length.
PagedAttention organizes cache blocks; it does not compress model weights.
Continuous batching can improve throughput, but does not guarantee lower latency.
Compare vLLM and SGLang using the workload you plan to serve.
Quantization can reduce memory, while speed and quality depend on hardware and method.
PTQ is a practical first test; QAT may help when PTQ misses a quality target.
Track cost per successful task and keep a rollback path.
Conclusion
Efficient LLM serving comes from matching the runtime and model format to real traffic. Serving engines help schedule work and manage cache; quantization may reduce weight memory. Start with a measured baseline, change one thing at a time, and judge the result by quality, user wait time, throughput, and cost.
References
Kwon et al. (2023), Efficient Memory Management for Large Language Model Serving with PagedAttention — Read the paper.
Zheng et al. (2023), SGLang: Efficient Execution of Structured Language Model Programs — Read the paper.
vLLM, serving overview and features — vLLM documentation.
vLLM, PagedAttention — Design notes.
vLLM, prefix caching — Design notes.
SGLang — Documentation.
Hugging Face Transformers, quantization overview — Quantization guide.
Hugging Face Transformers, quantization concepts — Concept guide.
Want us to build this for your team?
We design and ship enterprise AI systems — from architecture to production. Book a 30-minute call and we'll map out exactly how it fits your stack.
About the Author
Related Articles
Why We Built an AI That Refuses to Act Without You
A walkthrough of the Zero-Drift framework: Three autonomous agents, One human gate, and why that's the only way enterprise AI can actually ship.

Implementing Real-Time Drift Detection and Automated Model Rollbacks
From Silent Model Degradation to Self-Healing ML Systems
Mitigating Training–Serving Skew Using Enterprise Feature Stores
Building a Single Source of Truth for Production ML Features